14 October 2017
QNX kernel event tracing
QNX is by no means a perfect operating system, but some things it gets just right. Kernel instrumentation is among those things. The instrumented versions procnto-instr and procnto-smp-instr offer about 98% of the performance of the non-instrumented kernel versions while they aren't logging. That means in general the overhead of the instrumented kernel is negligible and you can deploy it everywhere, even in production environments. In fact, they discontinued the non-instrumented version of the kernel in the QNX 7.0 release. Despite the low overhead, the instrumentation is surprisingly powerful. It allows the developer to trace a variety of events such as interrupts, interprocess communication, I/O events, thread scheduling/preemption and also user-defined events emitted by own programs. All these events can be viewed, labelled and filtered in a rich interface which is seamlessly integrated into the QNX Momentics IDE.
While I was debugging timing problems with our EtherCAT master thread on QNX, it was only thanks to this powerful tool that I was able to find the culprit. The timing problems which we experienced were in the order of magnitude of around 60 microseconds, but when they happened, they made the connection unstable for a few seconds until the controller settled down again.
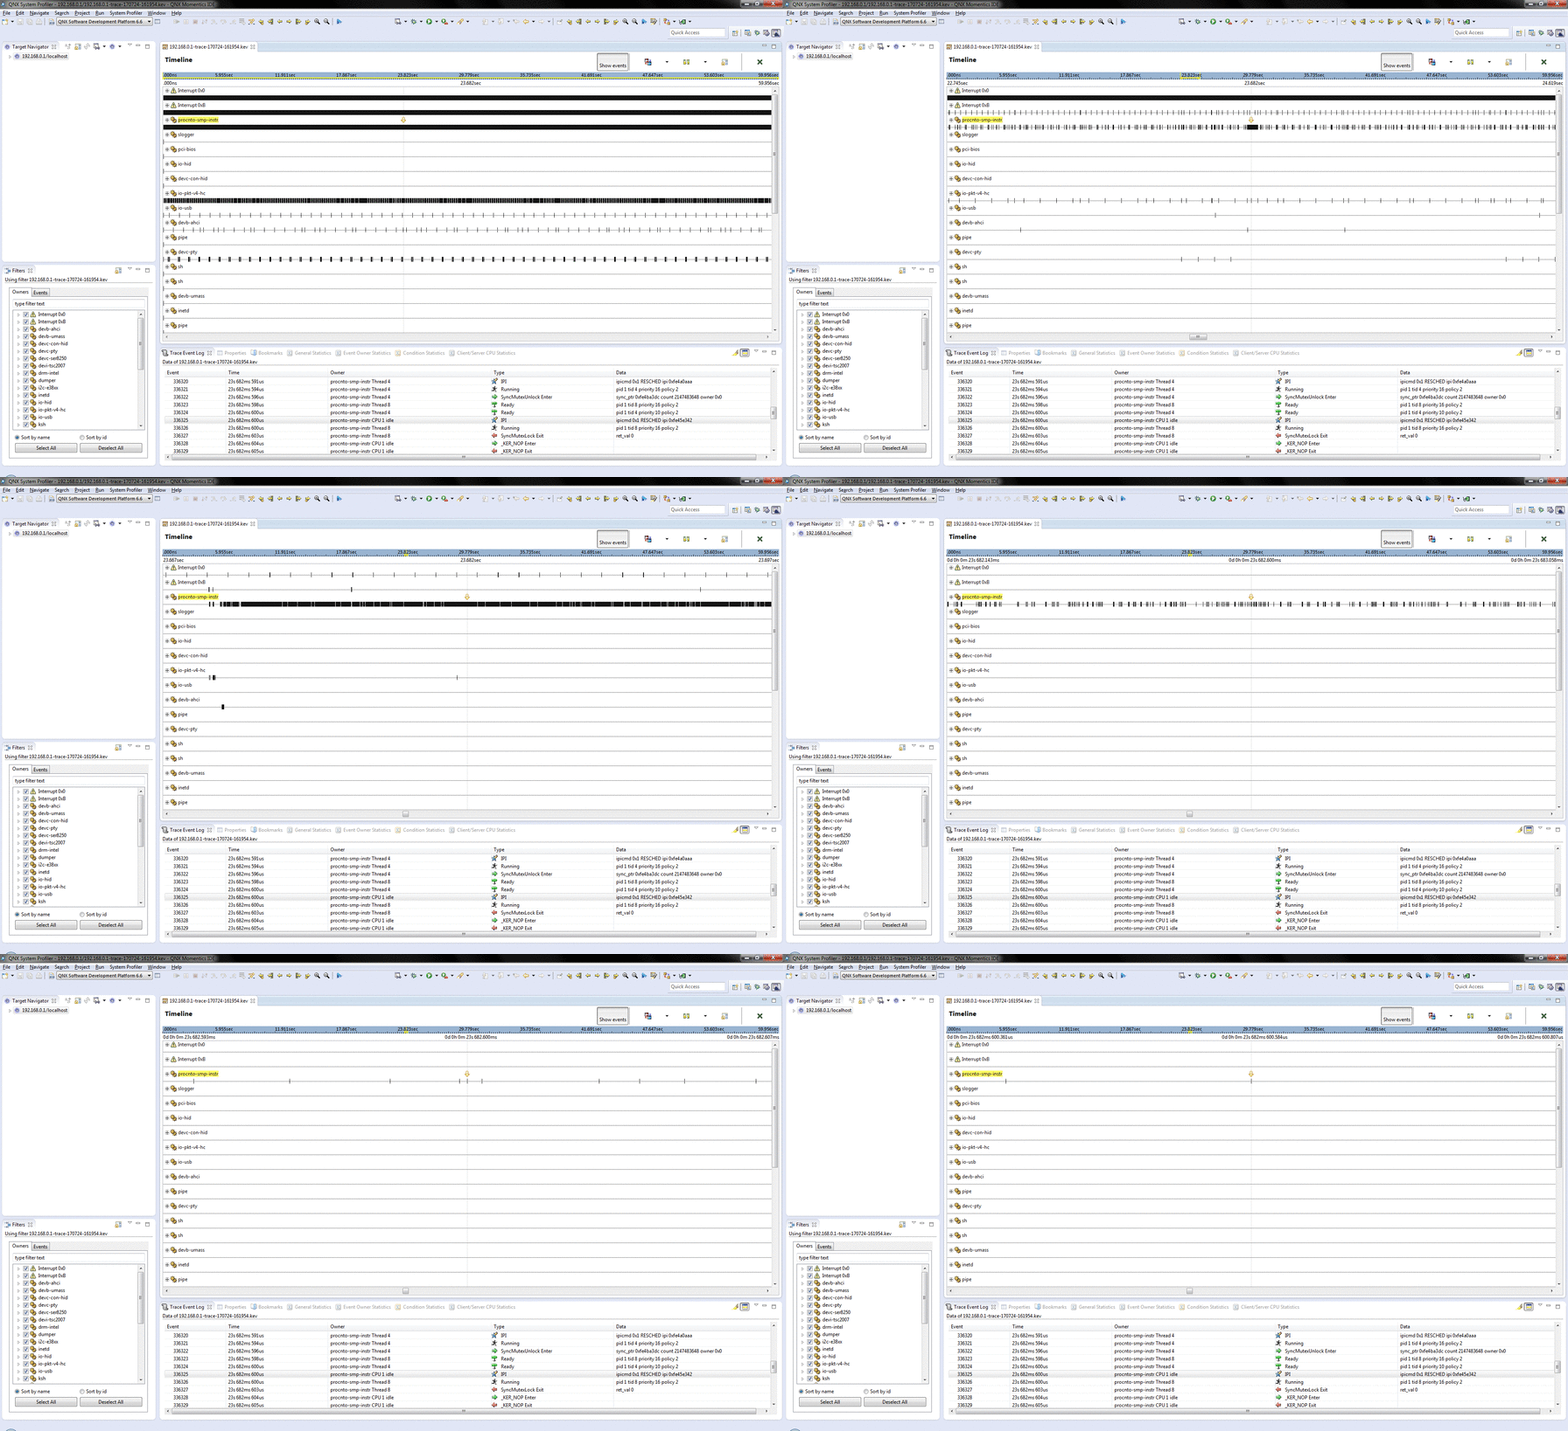
To analyse this problem, it was not unusual that I had to take kernel event traces with a length of up to 60 seconds. Now, let's take a closer look at the relations here. Suppose we are searching for a problem that lasted for 60 microseconds. That means, it is one millionth of the time line of a 60 seconds kernel event trace. The earth's circumference is 40'075 km. Suppose we look at the earth from space, that means the longest strip of the earth which we see is roughly 20037.5 km long. One millionth of that is 20m. So finding this problem in the kernel event trace timeline by visually inspecting it would be like searching for one particular tree, house or yacht on half the equator. The relations here blow my mind. As you zoom into the timeline of the kernel event trace, it feels like one of those movies that zoom in from a satellite all the way to someone's house.

Depicted above: A zoom from a window size of 60 seconds to about half a microsecond.
Luckily we can emit custom events and search for them in the kernel event trace. That way, we really can zoom right in on the problem! In our case, the culprit was excessive interprocessor interrupts for TLB flushing. Simply explained: The computer has a memory management unit that translates virtual memory addresses to physical addresses. To speed up memory accesses, there is a translation lookaside buffer (TLB), implemented directly in hardware (the computer with which you are reading this text most likely contains these things too). The TLB is basically a cache that stores these address translations for quick repeated access. Now, when the mapping between the virtual and the physical addresses changes, then this cache needs to be flushed (either partially or fully emptied) to make sure we don't make any erroneous translations based on old data. And as it happens, spawning and ending processes on a multicore QNX system causes nasty TLB flush storms, taking up valuable time and blocking the processors, preventing them from adhering to the hard realtime constraints we have. In our case, this was caused by a section of code that periodically executed a shell script which used netstat, grep and awk to read IP addresses - so it spawned at least 4 processes every 5 seconds. Funnily (or rather, embarrassingly) enough, the IP addresses that were collected by this script were not even used, such that with a few swift strokes on the keyboard, the problem was solved. The only question that remains is why someone thought it was a good idea to use shell scripts instead of C library calls to get the IP address of the device. This is the kind of code that almost causes physical pain when I read it. Remember, ioctl() might leave a stale taste in the mouth but it's good for your bones. Never do system()!
Post comment
Comments
(no comments yet)